4. Preparing Your Data
Learn to pre-process your geometries before performing any analysis.
4.1. Extruding Heights from your Geometries
Once you have loaded your data, it will appear on your screen as well as in your Layers. The geometries are, for now, flat. To analyse our data, we must first extrude the geometries to their corresponding heights.
See also
To do this, click Extensions > t4su > Edit > FootprintExtruder
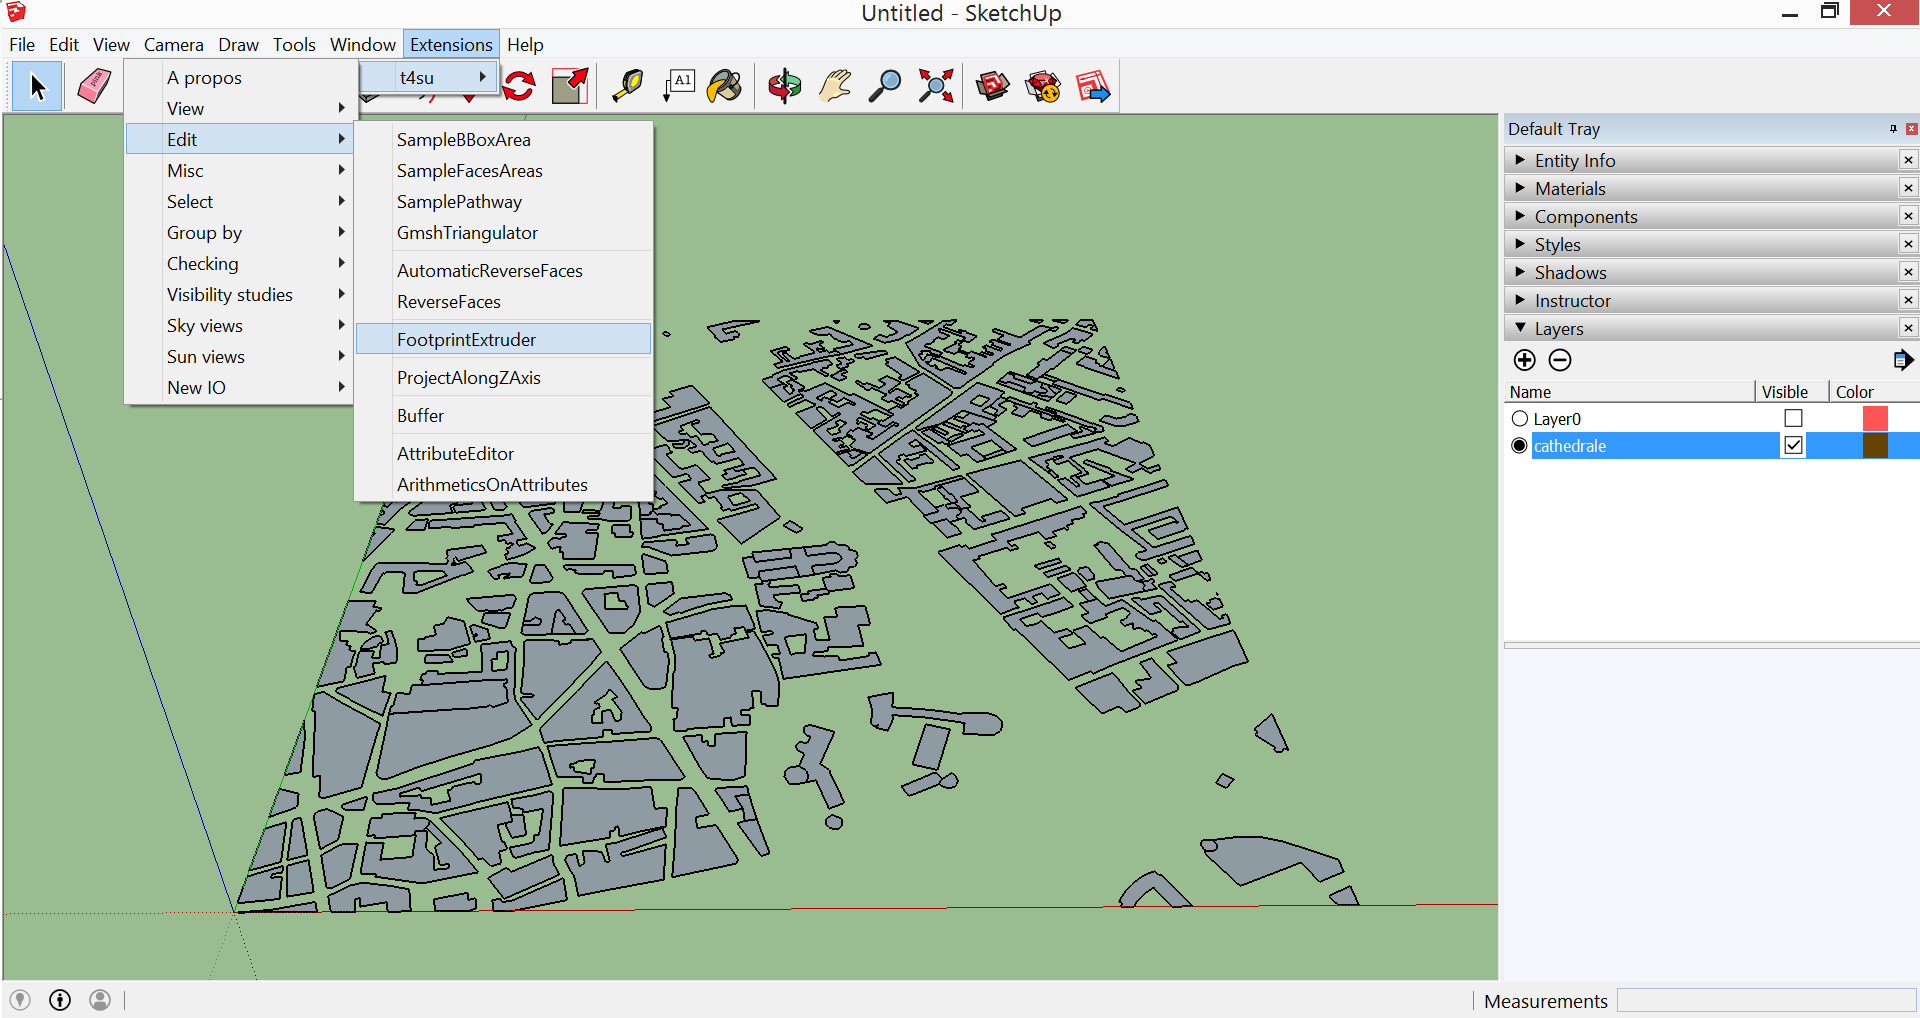
A new window will open, asking for the attribute’s name. Select the name of the column where your heights are stored.
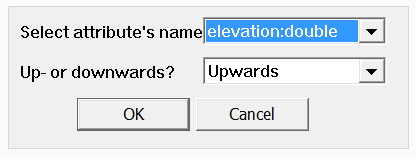
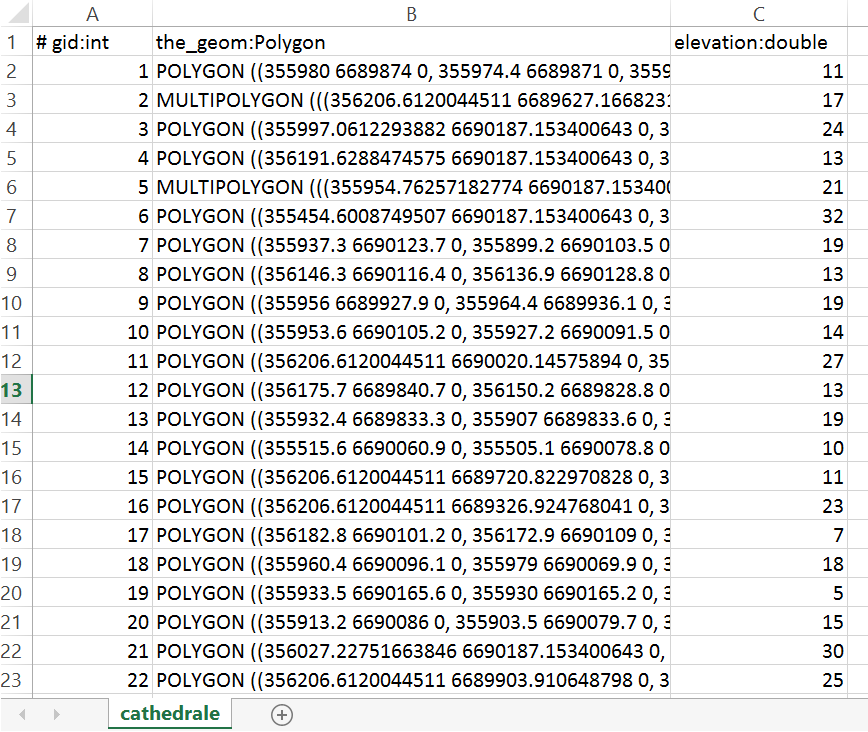
If you are not sure which column it is, open your file in an external application and check. Here is an example of a WellKnown-Text file : the attribute we are looking for is named “elevation:double”.
Select whether you would like the geometries to be extruded Upwards (Z direction) or Downwards (-Z direction) and click Okay.
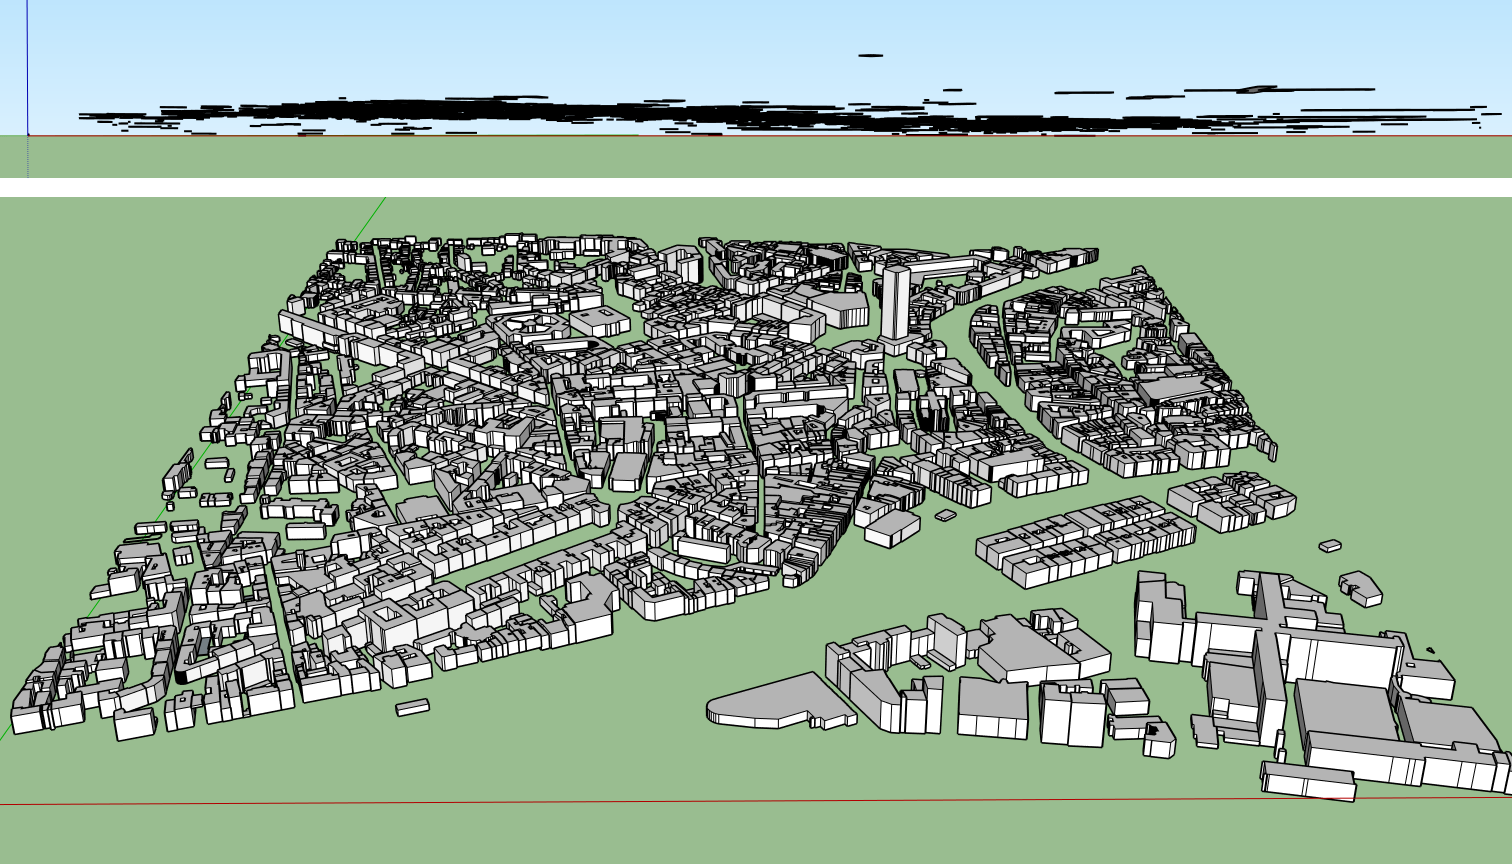
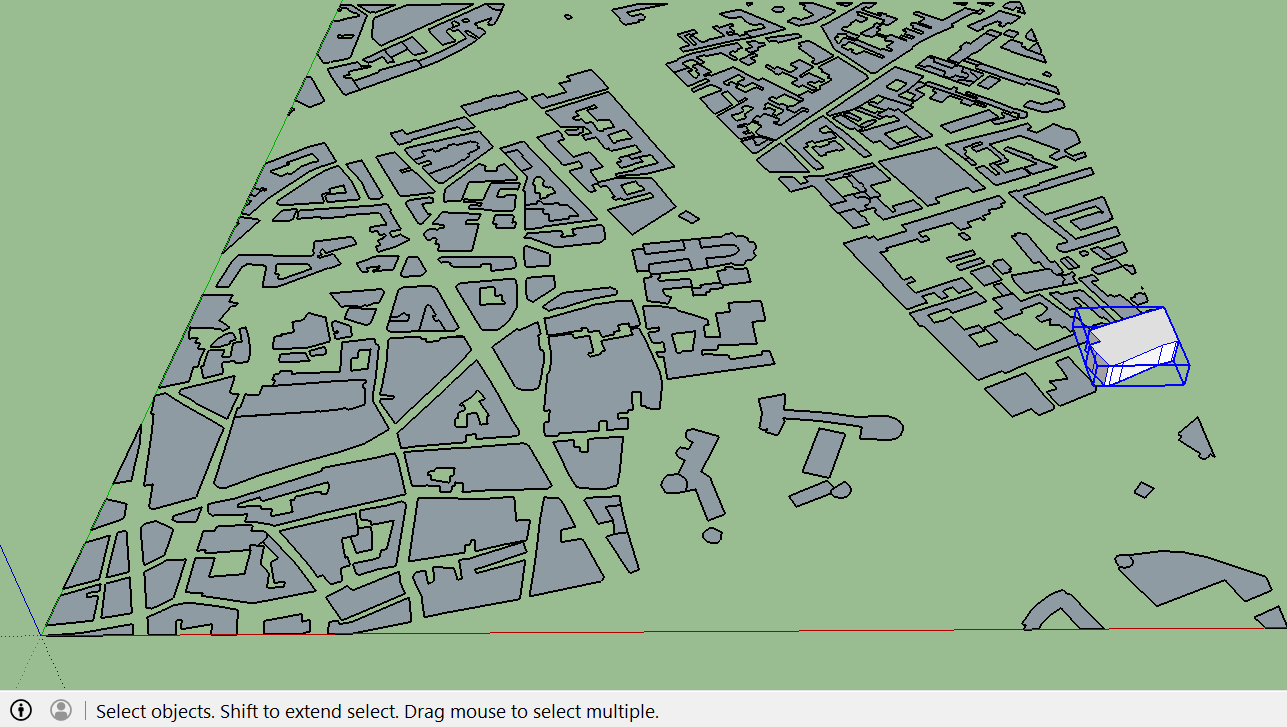
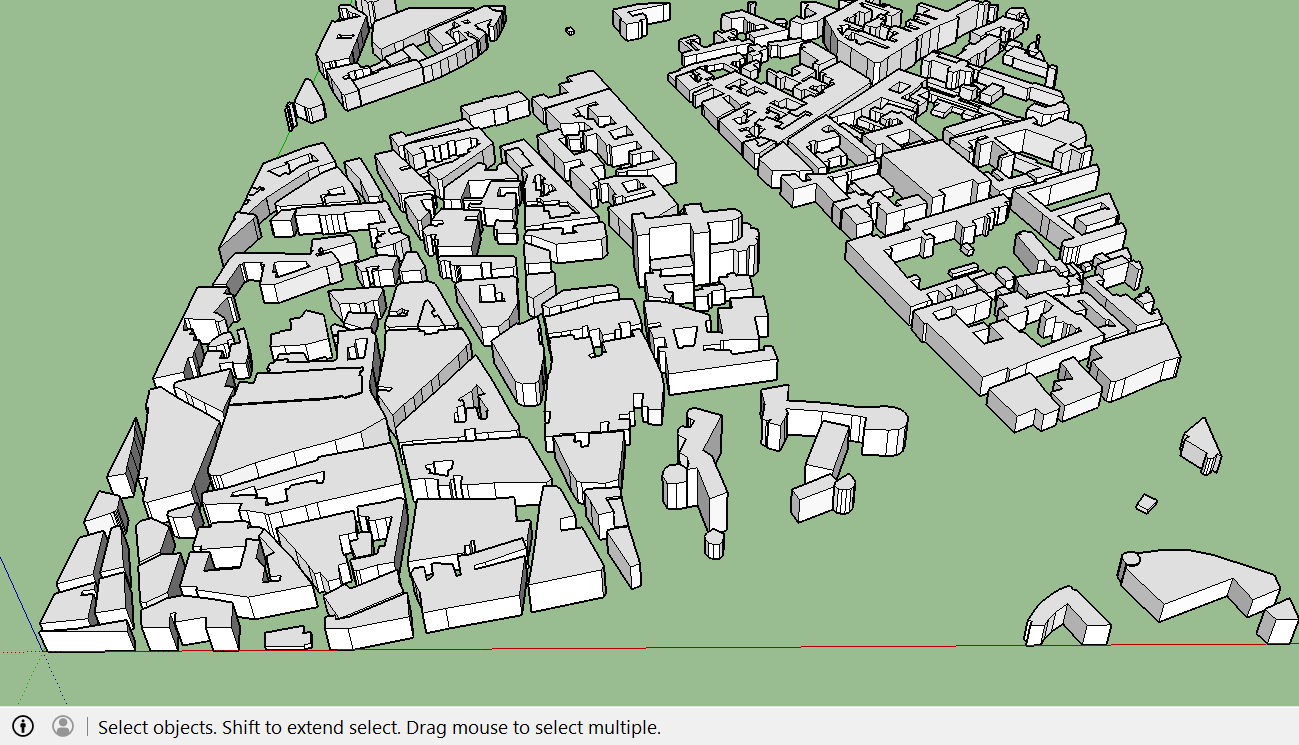
Top Image : The imported geometries are rooftops. Bottom Image : Rooftops have been extruded downwards to create buildings
Warning
If you do not select a specific object, the extrusion will be carried over all geometries. You may also select specific geometries before extruding, in which case only the selected figures will be affected by the extrusion.
4.2. Checking the Normal Vector of your Geometries
For any simulation to run smoothly, you must make sure that all of your two-dimensional geometries face the correct direction.
To check this, just click Extensions > t4su > View > PlotAllNormals. The following box will appear. Select the correct layer name, and size of the vectors :
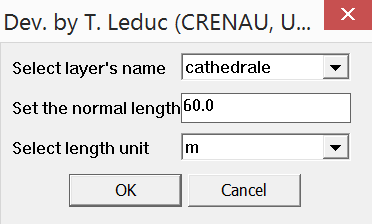
Checking Normals Comand Box
Once you click OK, a new layer will be created resembling this screenshot:
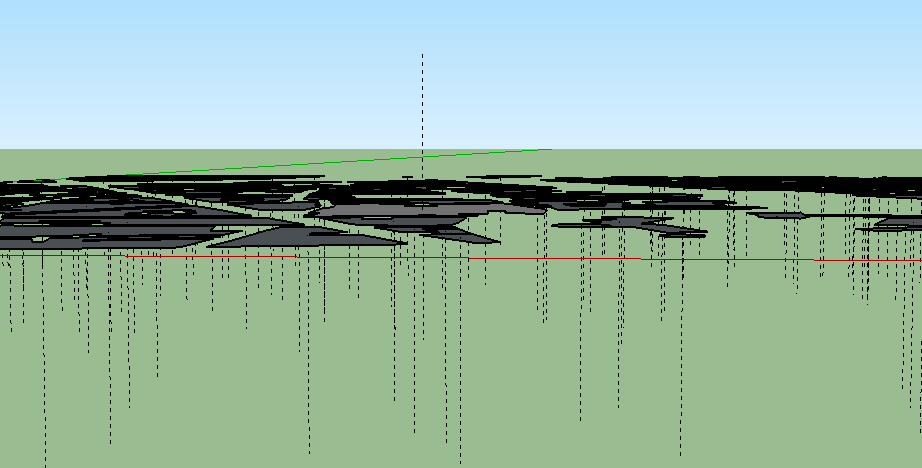
Incorectly Positioned Normal Vectors.
As you can notice, one of the geometries is facing the wrong way. Let’s change that :
- select the faces you wish to reverse
- click on Extensions > t4su > Edit > ReverseFaces
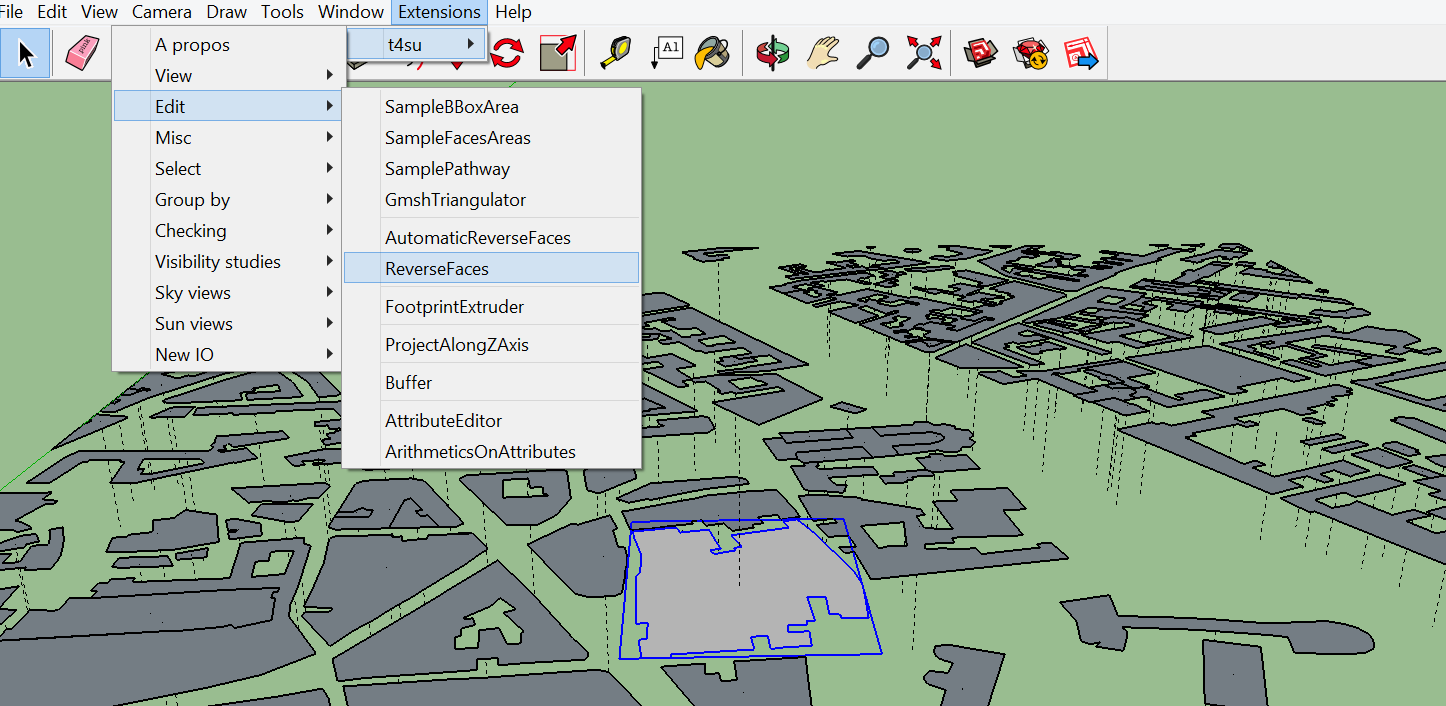
- Delete the obsolete PlotAllNormals layer
- Repeat Extensions > t4su > View > PlotAllNormals to see if everything worked.
4.3. Recreating a Terrain with Contour Lines
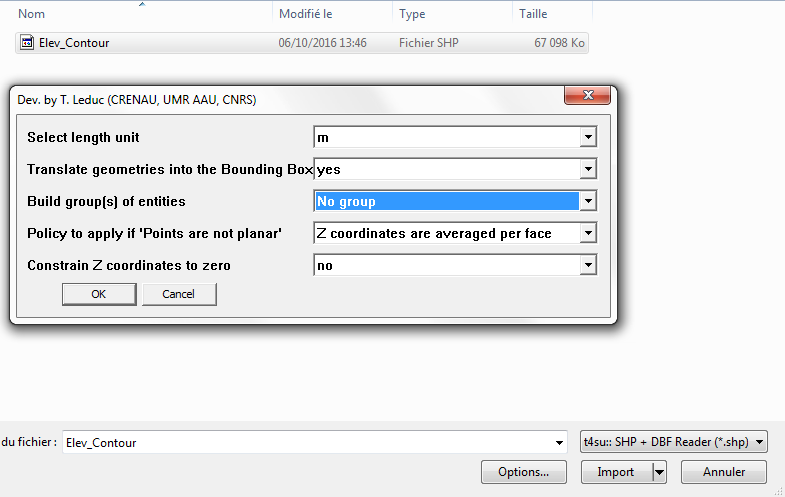
On many topographical maps, altitude levels are frequently represented by contour lines, or “isohypes” : lines representing equal elevation. We can turn these isolines into a usable digital terrain model. Start by importing your lines.
See also
This case has an extra step during the import process : click on Options.. and change the Build group(s) of entities line to “No group”.
Next, select everything (Ctrl+A) and click on Draw > Sandbox > From Contours. If when selected, your geometries appear individually bounded by selections boxes, it means you’ve forgotten to import them as No Group. Instead of re-importing your geometries, you can right-click on your selected geometries, then hit Explode.
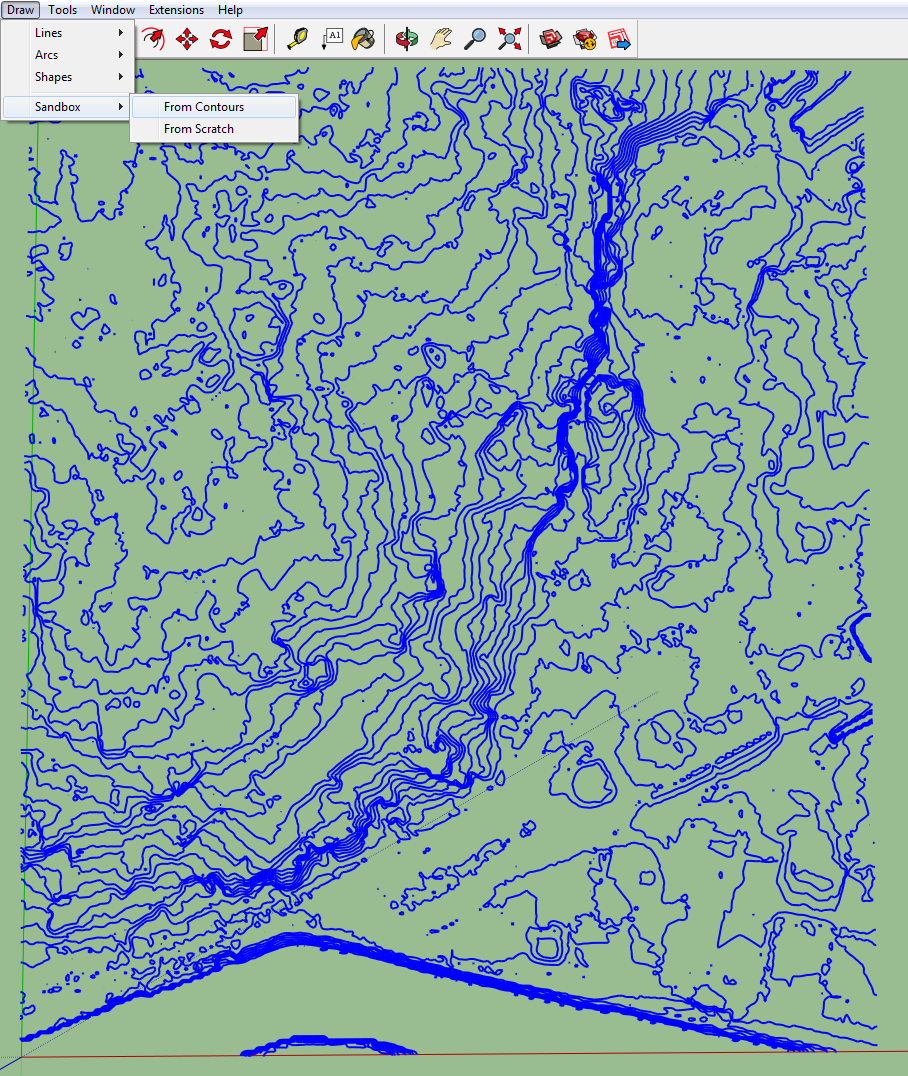
Correct importation of isolines.
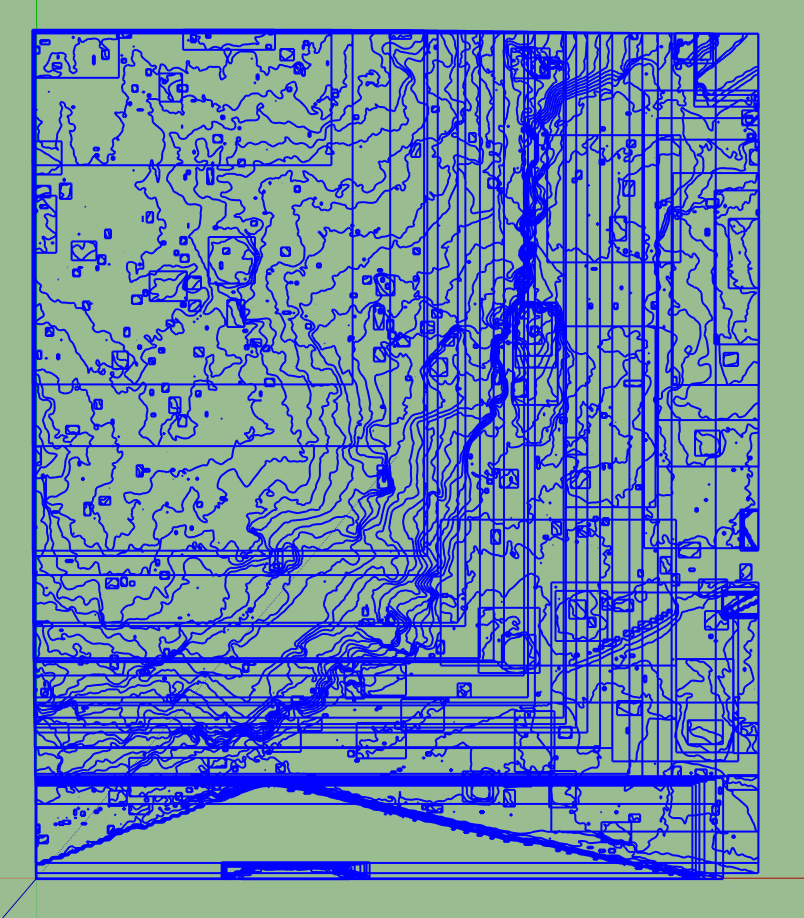
Incorrect importation of isolines.
You should end up with a layer that resembles this:
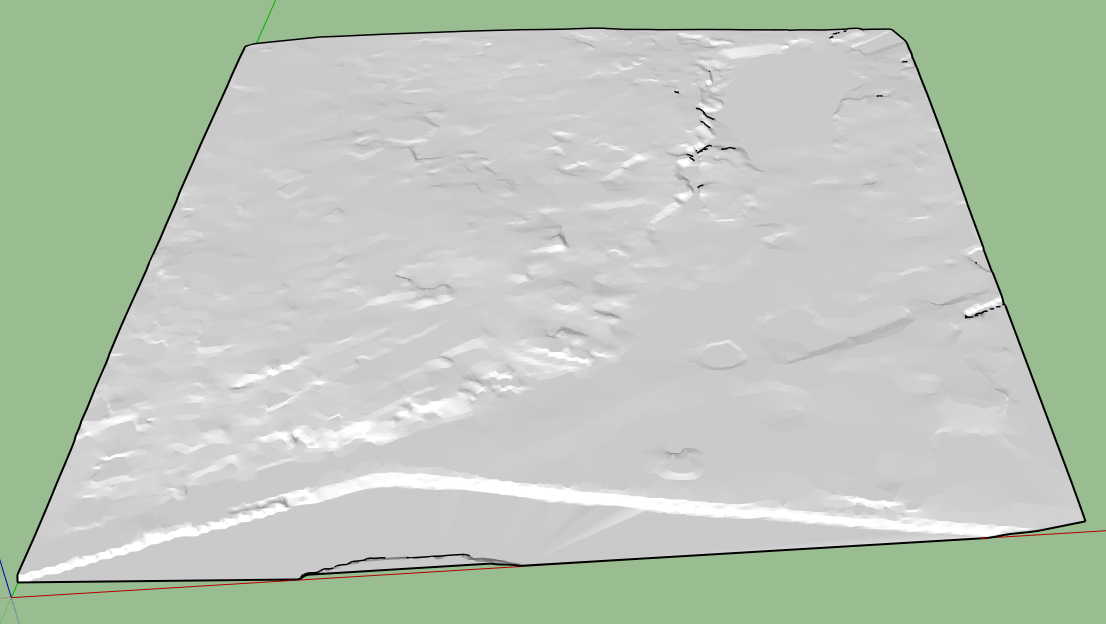
Simplified TIN Model.
Visibility, including sky view factors, changes on a rough terrain: our sky view is much more restrained at the bottom of a valley than at the top of a hill. Adding precise altitudes to your map will greatly aid in the accuracy of your calculations.
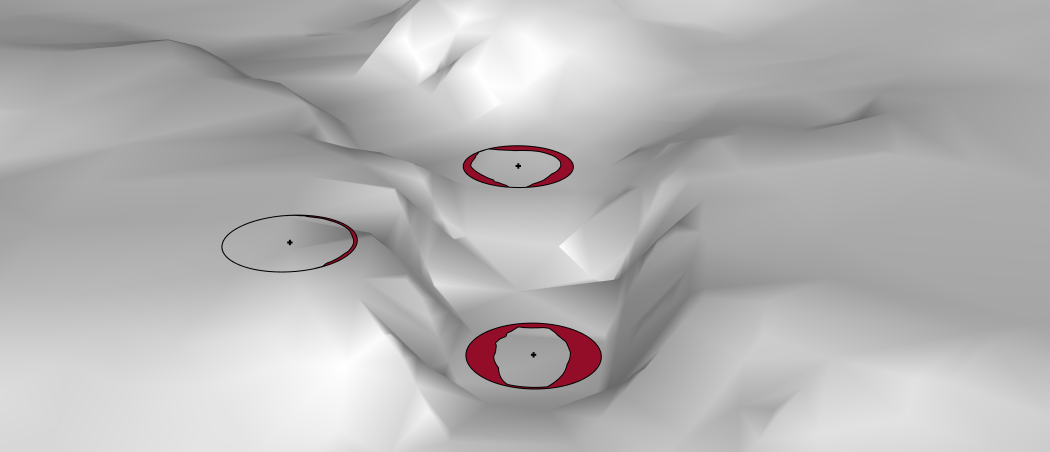
Close-up of three “2D Sky-Maps” on a rough terrain : areas in dips and valleys “see” less of the the sky than the tops of hills.
4.4. Projecting Along the Z Axis
Projecting along the Z-axis is really helpful in plotting many objects, like trees or people, on a uneven terrain. The concepts is pretty straightforward : we first import or create a layer of points, then project them on our target surfaces. This technique also works for line segments. So first, import your uneven ground layer and the layers to be projected:
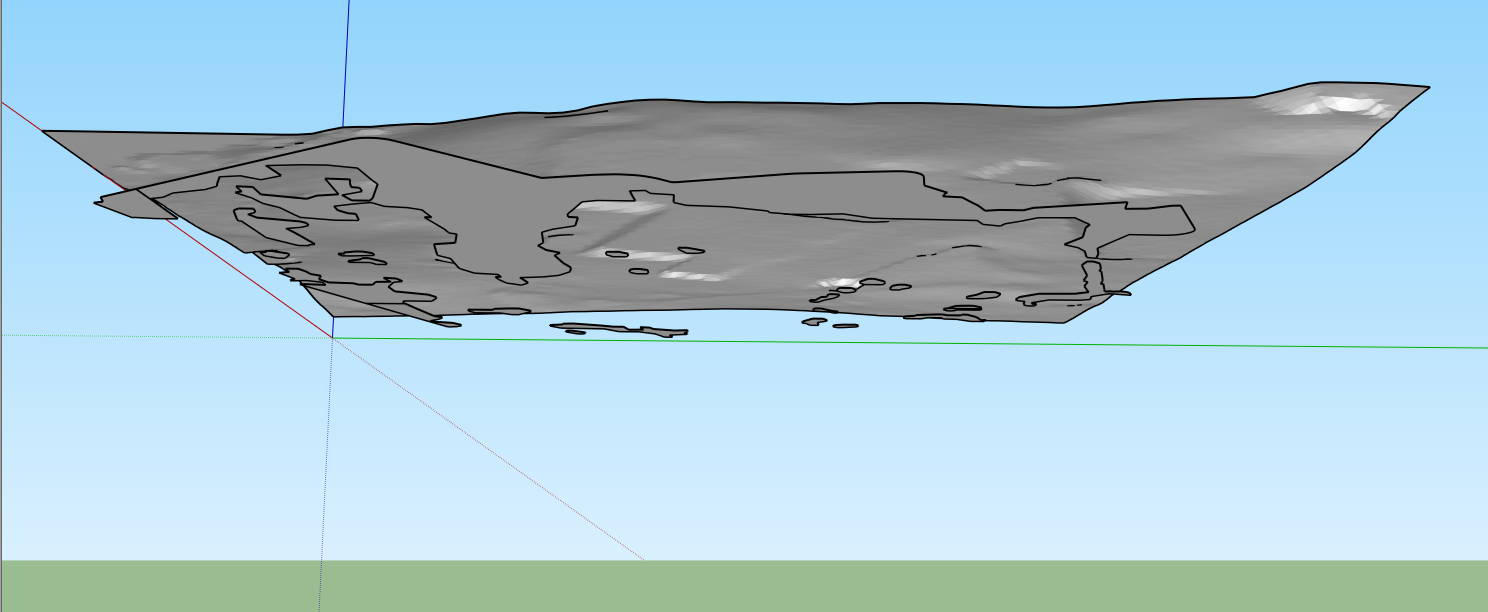
Rough Terrain Layer above a Layer Representing Wooded Areas.
Below our ground layer, we can see another set of geometries which correspond in this case to forested areas. That is the layer to perform a `point sample on.
Once you have your points, you can delete the previous layer : we’ll only be needing the points from now on. Hit t4su > Edit > ProjectAlongZAxis.
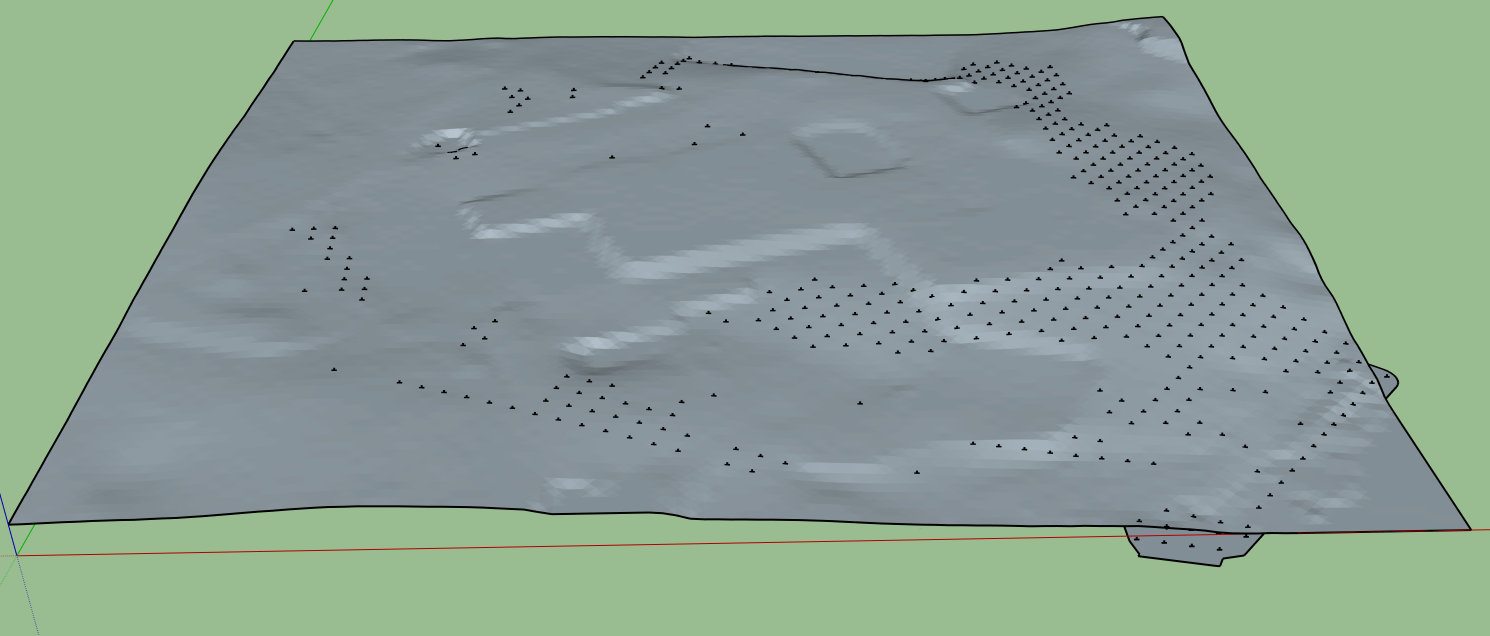
The “Wooded Area” Faces are Sampled into Points, which are then Projected onto our Terrain Layer.
Once the command box appears, select the layer containing your sampling points. Next, decide which direction to give to the projection : you may choose between upwards and downwards. Since our points were created from a layer below our ground layer, we are going to project upwards. If of course, your point layer is situated above the ground layer, chose downwards projection. This will result in your points “travelling” in the Z direction until they hit a face (in our case, the ground face). We can then use the projected sampling points as locations for more complex geometries.
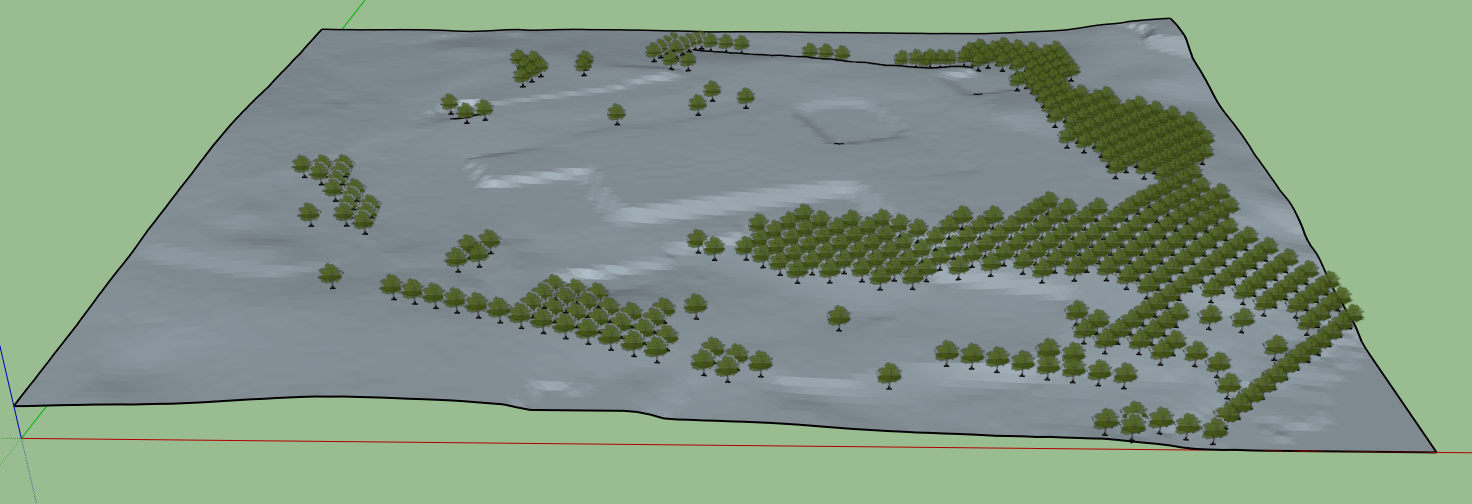
Example of the Use of Z-Axis Projection